*Deng Xiaoping fades from scene, d. 1997
“Second generation paramount leader”
“Technocrat” Secretary-Generals of CCP
*Zhao Ziyang, 1987-1989, d. Jan. 2005
*Jiang Zemin, 1989-2003
Chairman of Central Military Affairs Commission, 1993-2005
“Third generation paramount leader”
Hu Jintao, 2003-present
Chairman of Central Military Affairs Commission, 2005
“Fourth generation paramount leader”
"Technocrat” Premiers who were Zhao Ziyang's protégés
*Zhu Rongji, 1998-2003
*Wen Jiabao, 2003-2013
Foreign investment in coastal cities
New export-oriented industries, such as clothing and toys
Generate trade surplus
“Asianization”
Taiwanese and S. Korean investors
Foxconn manufactures to Apple, HP, etc. specifications
Market Reforms
Imported goods
Foreign exchange
State-owned enterprises (SOE)
Privatization through stock sales
Bankruptcy
More jobs lost than gained
Remaining key SOEs “Break the iron rice bowl”
Transformation from strategic to economic partnership, 2000-2016
3rd leading trade partner of U.S. (14% of trade in 2012)
Return to pre-Opium War world currency flows
PRC & Japan have been 2 largest foreign state holders of U.S. treasury notes since 2000
Transformation to “Rivals”?, 2017-????

1980 $24 billion
1997 $207 billion
2001 $262 billion
2004 $583 billion
2008 $1.435 trillion (3rd in world ranking)
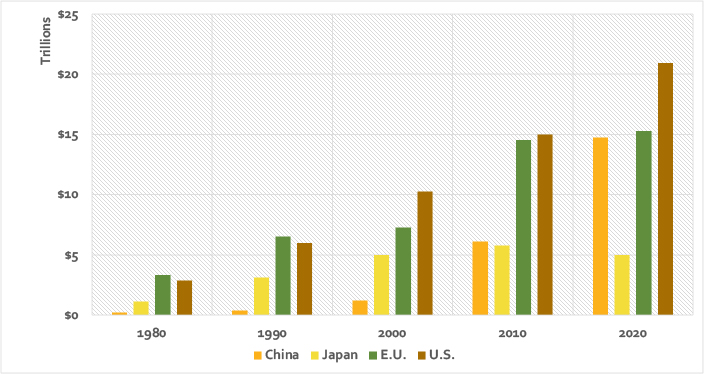
2012 $1.435 trillion (2nd in world after E.U.)
2014 $2.252 trillion (1st in world )
2020 $2.732 trillion (1st in world, U.S. is 2nd)
2004: US 21.1%, Hong Kong 17%, Japan 12.4%, South Korea 4.7%, Germany 4%
2008: US 17.7%, Hong Kong 13.3%, Japan 8.1%, South Korea 5.2%, Germany 4.1%
2013: Hong Kong 17.4%, US 16.7%, Japan 6.8%, South Korea 4.1%
2019: U.S. 17%, Hong Kong 10%, Japan 6% (2019)
2001: Canada 19%, Mexico 11.5%, Japan 11.1%, China 9%
2004: Canada 17%, China 13.8%, Mexico 10.3%, Japan 8.7%
2008: China 16.5%, Canada 15.7%, Mexico 10.1%, Japan 6.6%, Germany 4.6%
2013: China 19.6%, Canada 14.6%, Mexico 12.3%, Japan 6.1%, Germany 5%
2019: China 18%, Mexico 15%, Canada 13%, Japan 6%, Germany 5%
Why has per capita GDP improved but remained relatively low?
| China | U.S. | |||
|---|---|---|---|---|
| GDP per capita | World Rank | GDP per capita | World Rank | |
| 1998 | $750 | 149th | $29,340 | 10th |
| 2008 | $6000 | 133rd | $47,500 | 10th |
| 2014 | $11,300 | 113th | $54,800 | 19th |
| 2020 | $16,400 | 102nd | $60,200 | 17th |
Total Population 1.3 Billion
Labor force structure
Quarter of population still in farming
How have the contributions of different sectors of the economy to GDP changed over the past 3 decades?
| Sector/Year | 1980 | 2004 | 2008 | 2014 | 2017 |
|---|---|---|---|---|---|
| Agriculture | 30% | 14% | 11.3% | 9.7% | 7.9% |
| Services | 21% | 33% | 40.1% | 46.4% | 51.6% |
| Industry | 49% | 53% | 48.6% | 43.9% | 40.5% |
Why is there a mismatch between China’s economic and labor structures based on a comparison with the table above?
| Sector/Year | 2001 | 2006 | 2014 | 2017 |
|---|---|---|---|---|
| Agriculture | 49% | 43% | 33.6% | 28% |
| Services | 29% | 32% | 36.1% | 44% |
| Industry | 22% | 25% | 30.3% | 29% |
0.25 acres agricultural land/capita in 1982
2.1 acres in U.S.
240-290 million rural migrants annually since 2010!!
1. What debates about political reform occurred within the CCP since the late 1970s?
2. According to Zhao, “during the transition period from old to new economic systems, without, checks, corruption was bound to grow.” (p. 265, 4th full para, 1st sentence). What does he mean by this? What checks does he have in mind? (also see pp. 155-58)
3. Do you think China is ready for democracy?
1.82 Children born/woman (China)
2.98 Children born/woman (India)
2.07 Children born/woman (US)
1.1 male(s)/female (China)
1.05 male(s)/female (India)
1.05 male(s)/female (US)